![]()
In the modern periodic table chart, the properties of elements follow a periodic pattern based on their atomic numbers. The atomic number, which represents the number of protons in an atom’s nucleus, increases by one for each subsequent element. This pattern is the basis of the Modern Periodic Table, established by Henry Moseley in 1913. This order creates a systematic way to predict characteristics across the table’s rows (periods) and columns (groups).
Basic Elements of the Modern Periodic Table
The Modern Periodic Table has 18 vertical columns, called groups, and 7 horizontal rows, called periods. Each element in a group has the same number of valence (outer shell) electrons, resulting in similar chemical properties across the group.
As we move down a group, the number of electron shells increases, while the number of valence electrons remains constant. In contrast, moving from left to right across a period increases the number of valence electrons by one, as the atomic number also increases by one unit.

In the third period of the Modern Periodic Table, for example, elements like Na, Mg, Al, Si, P, S, Cl, and Ar are organized based on the filling of electrons in the K, L, and M shells. The maximum number of electrons each shell can hold is calculated by the formula 2n², where “n” is the shell number from the nucleus.
For instance, the K shell holds 2 electrons (since 2 × 1² = 2), giving the first period 2 elements, while the L shell holds 8 electrons (2 × 2² = 8), giving the second period 8 elements. Although the M shell can hold up to 18 electrons (2 × 3² = 18), only 8 are filled in the third period due to the limitation on the outermost shell.
Trends Observed in the Modern Periodic Table- Periodic Table Properties
Valency:
The valency of an element is based on the number of valence electrons in its outermost shell. Across a period, valency increases as the number of valence electrons increases from left to right and then decreases. In a group, valency remains the same because the number of valence electrons does not change.

Valency variation across a period. Source- CREST Olympiads

Valency constant down a group. Source- Chemistry LibreTexts
Atomic Size:
Atomic size, defined as the distance between the nucleus and the outermost shell, varies across the table. Moving left to right along a period, the atomic radius decreases due to an increase in nuclear charge, which pulls electrons closer to the nucleus, reducing atomic size. Down a group, however, atomic size increases because additional electron shells increase the distance between the nucleus and the outermost electrons, despite the increased nuclear charge.

Atomic radii across the periodic table. Source- surfguppy
Metallic and Non-metallic Character:
Metals like Na and Mg are on the left side of the table, while non-metals like sulfur and chlorine are on the right. Metalloids, such as silicon, fall in the middle, exhibiting properties of both metals and non-metals. A zig-zag line on the table separates metals from non-metals. Elements like boron, silicon, germanium, arsenic, antimony, tellurium, and polonium lie along this line and are classified as metalloids due to their intermediate properties.
Reactivity:
As effective nuclear charge on valence electrons increases across a period, elements are less likely to lose electrons, reducing metallic character. Conversely, down a group, the distance of the outer electrons from the nucleus increases. This makes it easier to lose electrons thus enhancing metallic character. Non-metals, being electronegative, tend to gain electrons to form bonds. This trend places non-metals towards the top right of the Periodic Table.
Oxide Nature:
Predicting the nature of oxides is also possible from periodic trends. Generally, metallic oxides are basic, whereas non-metallic oxides are acidic, aligning with the positions of metals and non-metals on the table.
How to memorize the Periodic Table?
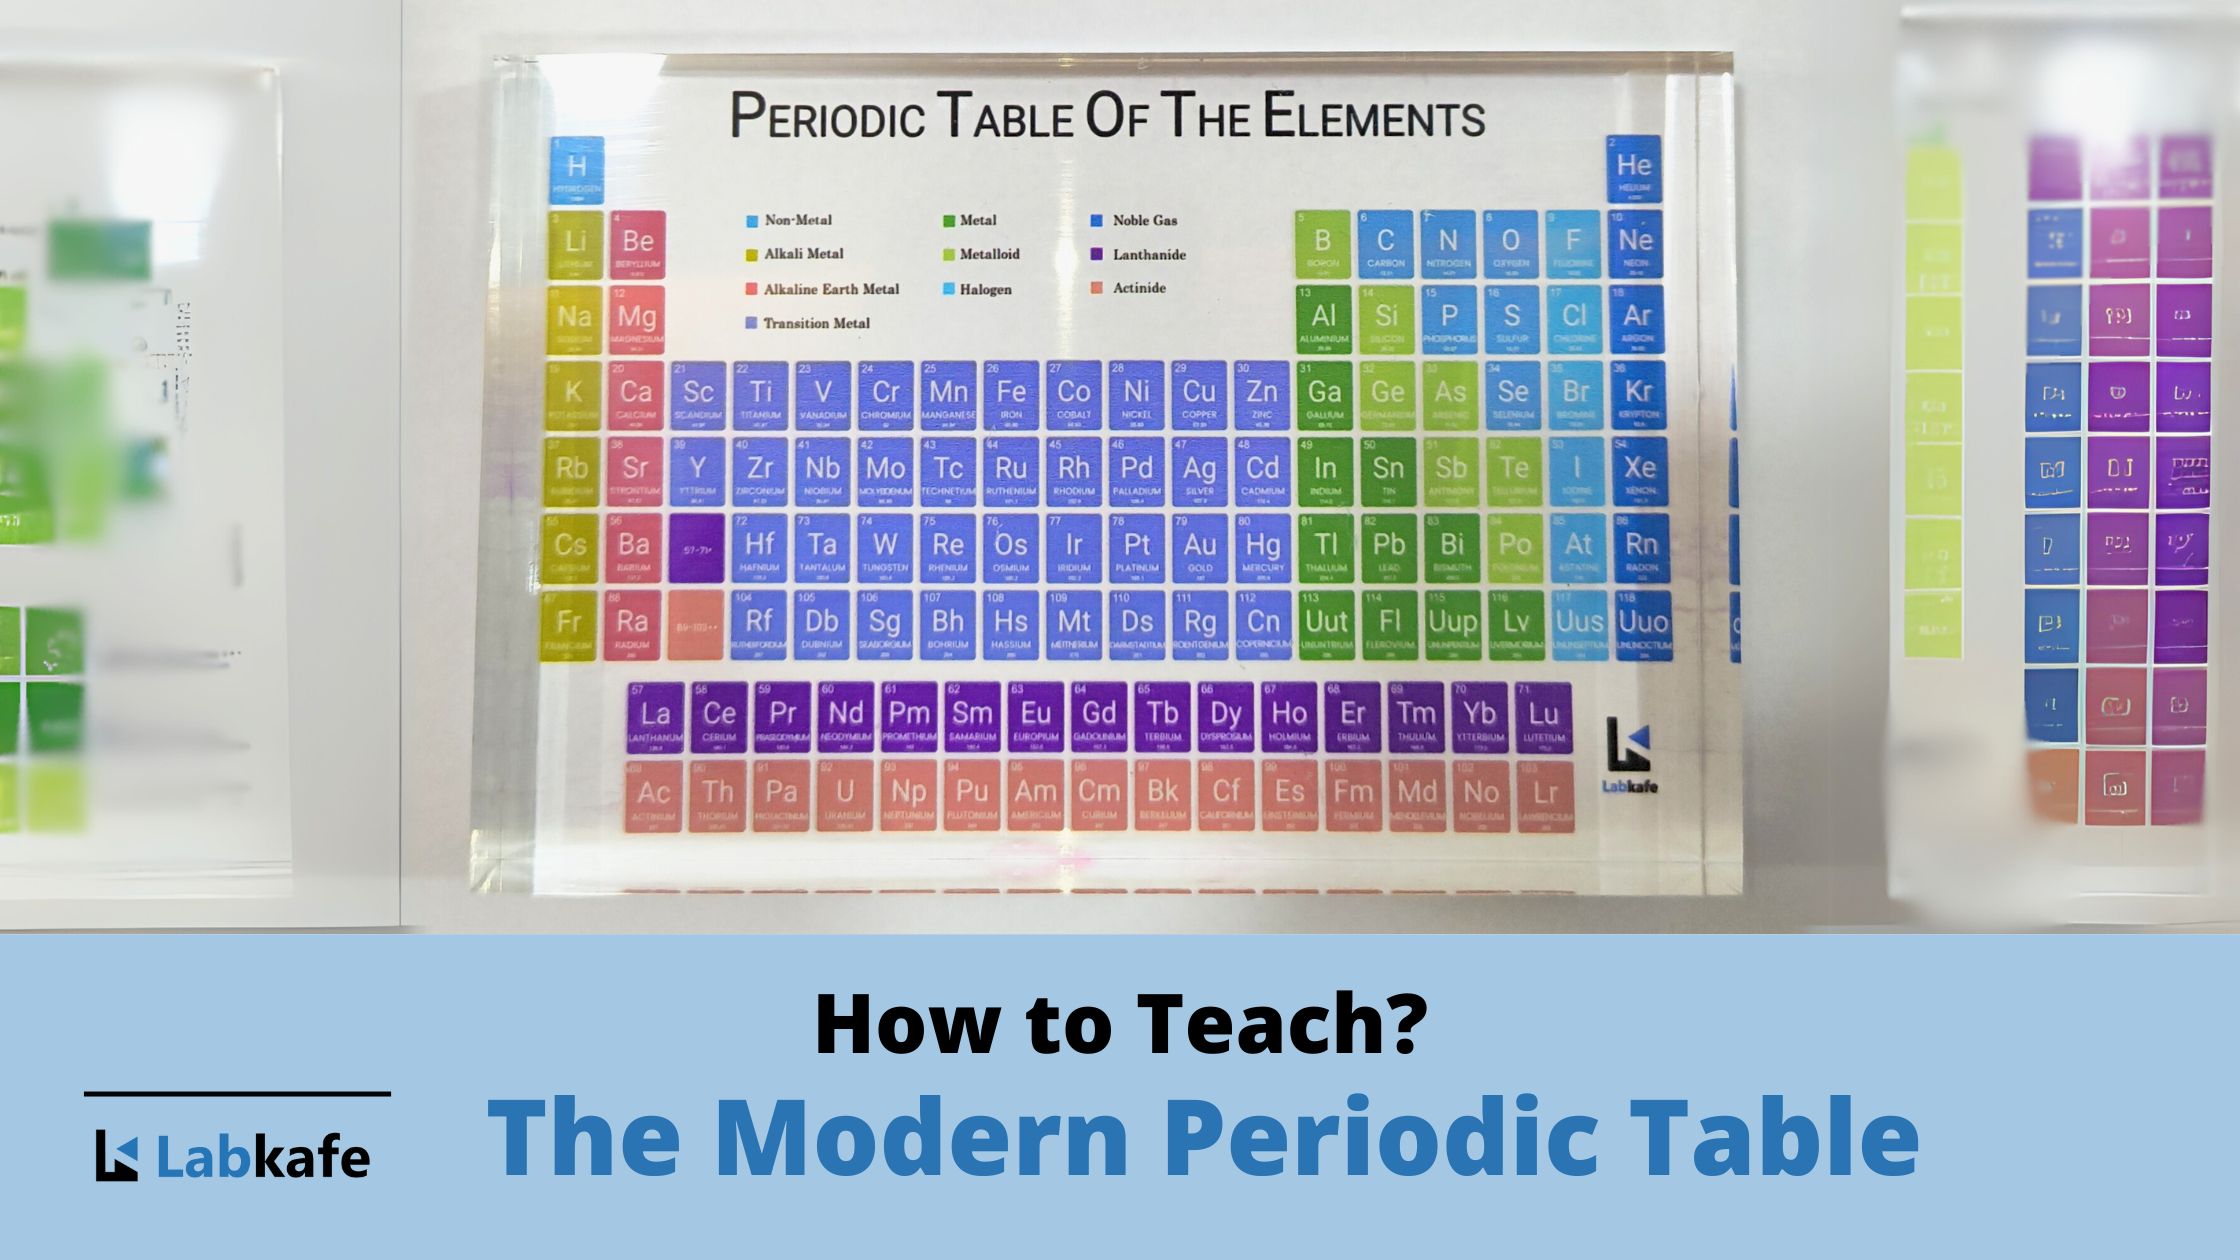
The best way to memorize the periodic table is through visualization. Use interesting mnemonics to aid memorization or consider purchasing a model like this. Our experts will guide you every step of the way!

Keep it on your table, and glance at it during your free time. The attractive colors and tactile sensation of the model will help you retain the names of elements easily.


Leave a Reply